Results!#
After running those jobs, you should be done!
Overview of the Results#
The following results should be in your output direcotry. The first tab provides a truncated results tree to help with visualization but you can see the complete tree from one pool with 6 samples in the second tab (Complete Tree).
.
├── ancestry_assignments.tsv
├── Ancestry_PCAs.png
├── common_snps_across_pools.tsv
├── file_directories.txt
├── Pool1
│   ├── bams
│   │   ├── 1.bam
│   │   ├── 1.bam.bai
│   │   ├── 2.bam
│   │   ├── 2.bam.bai
│   │   ├── 3.bam
│   │   ├── 3.bam.bai
│   │   ├── 4.bam
│   │   ├── 4.bam.bai
│   │   ├── 5.bam
│   │   ├── 5.bam.bai
│   │   ├── 6.bam
│   │   ├── 6.bam.bai
│   │   └── subset_bam.done
│   ├── individual_1
│   │   ├── common_snps
│   │   │   ├── final_subset_pruned_data.bed
│   │   │   ├── final_subset_pruned_data.bim
│   │   │   ├── final_subset_pruned_data.fam
│   │   │   ├── final_subset_pruned_data.log
│   │   │   ├── final_subset_pruned_data.pgen
│   │   │   ├── final_subset_pruned_data.psam
│   │   │   ├── final_subset_pruned_data.pvar
│   │   │   ├── snps_1000g.tsv
│   │   │   ├── SNPs2keep.txt
│   │   │   ├── snps_data.tsv
│   │   │   ├── subset_1000g.log
│   │   │   ├── subset_1000g.pgen
│   │   │   ├── subset_1000g.psam
│   │   │   ├── subset_1000g.pvar
│   │   │   ├── subset_data.log
│   │   │   ├── subset_data.pgen
│   │   │   ├── subset_data.prune.out
│   │   │   ├── subset_data.psam
│   │   │   ├── subset_data.pvar
│   │   │   ├── subset_pruned_1000g.bed
│   │   │   ├── subset_pruned_1000g.bim
│   │   │   ├── subset_pruned_1000g.fam
│   │   │   ├── subset_pruned_1000g.log
│   │   │   ├── subset_pruned_1000g.pgen
│   │   │   ├── subset_pruned_1000g.popu
│   │   │   ├── subset_pruned_1000g.prune.in
│   │   │   ├── subset_pruned_1000g.prune.out
│   │   │   ├── subset_pruned_1000g.psam
│   │   │   ├── subset_pruned_1000g.pvar
│   │   │   ├── subset_pruned_data_1000g_key.txt
│   │   │   ├── subset_pruned_data.log
│   │   │   ├── subset_pruned_data_original.pvar
│   │   │   ├── subset_pruned_data.pgen
│   │   │   ├── subset_pruned_data.psam
│   │   │   ├── subset_pruned_data.pvar
│   │   │   └── subset_pruned_data_temp.pvar
│   │   ├── freebayes_hg19.vcf
│   │   ├── freebayes_hg19.vcf.unmap
│   │   ├── freebayes.log
│   │   ├── freebayes.pgen
│   │   ├── freebayes.psam
│   │   ├── freebayes.pvar
│   │   ├── freebayes.pvar_original
│   │   ├── freebayes_tmp.pvar
│   │   ├── freebayes.vcf
│   │   ├── pca_projection
│   │   │   ├── final_subset_pruned_data_pcs.log
│   │   │   ├── final_subset_pruned_data_pcs.sscore
│   │   │   ├── subset_pruned_1000g_pcs.acount
│   │   │   ├── subset_pruned_1000g_pcs.eigenval
│   │   │   ├── subset_pruned_1000g_pcs.eigenvec
│   │   │   ├── subset_pruned_1000g_pcs.eigenvec.allele
│   │   │   ├── subset_pruned_1000g_pcs.log
│   │   │   ├── subset_pruned_1000g_pcs_projected.log
│   │   │   └── subset_pruned_1000g_pcs_projected.sscore
│   │   └── pca_sex_checks_original
│   │       ├── ancestry_assignments.tsv
│   │       ├── Ancestry_PCAs.png
│   │       └── variables.tsv
│   ├── individual_2
│   │   ...
│   ├── individual_3
│   │   ...
│   ├── individual_4
│   │   ...
│   ├── individual_5
│   │   ├── common_snps
│   │   ...
│   └── individual_6
│   └── ...
└── snps_1000g_common_across_sites.tsv
.
├── ancestry_assignments.tsv
├── Ancestry_PCAs.png
├── common_snps_across_pools.tsv
├── file_directories.txt
├── Pool1
│   ├── bams
│   │   ├── 1.bam
│   │   ├── 1.bam.bai
│   │   ├── 2.bam
│   │   ├── 2.bam.bai
│   │   ├── 3.bam
│   │   ├── 3.bam.bai
│   │   ├── 4.bam
│   │   ├── 4.bam.bai
│   │   ├── 5.bam
│   │   ├── 5.bam.bai
│   │   ├── 6.bam
│   │   ├── 6.bam.bai
│   │   └── subset_bam.done
│   ├── individual_1
│   │   ├── common_snps
│   │   │   ├── final_subset_pruned_data.bed
│   │   │   ├── final_subset_pruned_data.bim
│   │   │   ├── final_subset_pruned_data.fam
│   │   │   ├── final_subset_pruned_data.log
│   │   │   ├── final_subset_pruned_data.pgen
│   │   │   ├── final_subset_pruned_data.psam
│   │   │   ├── final_subset_pruned_data.pvar
│   │   │   ├── snps_1000g.tsv
│   │   │   ├── SNPs2keep.txt
│   │   │   ├── snps_data.tsv
│   │   │   ├── subset_1000g.log
│   │   │   ├── subset_1000g.pgen
│   │   │   ├── subset_1000g.psam
│   │   │   ├── subset_1000g.pvar
│   │   │   ├── subset_data.log
│   │   │   ├── subset_data.pgen
│   │   │   ├── subset_data.prune.out
│   │   │   ├── subset_data.psam
│   │   │   ├── subset_data.pvar
│   │   │   ├── subset_pruned_1000g.bed
│   │   │   ├── subset_pruned_1000g.bim
│   │   │   ├── subset_pruned_1000g.fam
│   │   │   ├── subset_pruned_1000g.log
│   │   │   ├── subset_pruned_1000g.pgen
│   │   │   ├── subset_pruned_1000g.popu
│   │   │   ├── subset_pruned_1000g.prune.in
│   │   │   ├── subset_pruned_1000g.prune.out
│   │   │   ├── subset_pruned_1000g.psam
│   │   │   ├── subset_pruned_1000g.pvar
│   │   │   ├── subset_pruned_data_1000g_key.txt
│   │   │   ├── subset_pruned_data.log
│   │   │   ├── subset_pruned_data_original.pvar
│   │   │   ├── subset_pruned_data.pgen
│   │   │   ├── subset_pruned_data.psam
│   │   │   ├── subset_pruned_data.pvar
│   │   │   └── subset_pruned_data_temp.pvar
│   │   ├── freebayes_hg19.vcf
│   │   ├── freebayes_hg19.vcf.unmap
│   │   ├── freebayes.log
│   │   ├── freebayes.pgen
│   │   ├── freebayes.psam
│   │   ├── freebayes.pvar
│   │   ├── freebayes.pvar_original
│   │   ├── freebayes_tmp.pvar
│   │   ├── freebayes.vcf
│   │   ├── pca_projection
│   │   │   ├── final_subset_pruned_data_pcs.log
│   │   │   ├── final_subset_pruned_data_pcs.sscore
│   │   │   ├── subset_pruned_1000g_pcs.acount
│   │   │   ├── subset_pruned_1000g_pcs.eigenval
│   │   │   ├── subset_pruned_1000g_pcs.eigenvec
│   │   │   ├── subset_pruned_1000g_pcs.eigenvec.allele
│   │   │   ├── subset_pruned_1000g_pcs.log
│   │   │   ├── subset_pruned_1000g_pcs_projected.log
│   │   │   └── subset_pruned_1000g_pcs_projected.sscore
│   │   └── pca_sex_checks_original
│   │       ├── ancestry_assignments.tsv
│   │       ├── Ancestry_PCAs.png
│   │       └── variables.tsv
│   ├── individual_2
│   │   ├── common_snps
│   │   │   ├── final_subset_pruned_data.bed
│   │   │   ├── final_subset_pruned_data.bim
│   │   │   ├── final_subset_pruned_data.fam
│   │   │   ├── final_subset_pruned_data.log
│   │   │   ├── final_subset_pruned_data.pgen
│   │   │   ├── final_subset_pruned_data.psam
│   │   │   ├── final_subset_pruned_data.pvar
│   │   │   ├── snps_1000g.tsv
│   │   │   ├── SNPs2keep.txt
│   │   │   ├── snps_data.tsv
│   │   │   ├── subset_1000g.log
│   │   │   ├── subset_1000g.pgen
│   │   │   ├── subset_1000g.psam
│   │   │   ├── subset_1000g.pvar
│   │   │   ├── subset_data.log
│   │   │   ├── subset_data.pgen
│   │   │   ├── subset_data.prune.out
│   │   │   ├── subset_data.psam
│   │   │   ├── subset_data.pvar
│   │   │   ├── subset_pruned_1000g.bed
│   │   │   ├── subset_pruned_1000g.bim
│   │   │   ├── subset_pruned_1000g.fam
│   │   │   ├── subset_pruned_1000g.log
│   │   │   ├── subset_pruned_1000g.pgen
│   │   │   ├── subset_pruned_1000g.popu
│   │   │   ├── subset_pruned_1000g.prune.in
│   │   │   ├── subset_pruned_1000g.prune.out
│   │   │   ├── subset_pruned_1000g.psam
│   │   │   ├── subset_pruned_1000g.pvar
│   │   │   ├── subset_pruned_data_1000g_key.txt
│   │   │   ├── subset_pruned_data.log
│   │   │   ├── subset_pruned_data_original.pvar
│   │   │   ├── subset_pruned_data.pgen
│   │   │   ├── subset_pruned_data.psam
│   │   │   ├── subset_pruned_data.pvar
│   │   │   └── subset_pruned_data_temp.pvar
│   │   ├── freebayes_hg19.vcf
│   │   ├── freebayes_hg19.vcf.unmap
│   │   ├── freebayes.log
│   │   ├── freebayes.pgen
│   │   ├── freebayes.psam
│   │   ├── freebayes.pvar
│   │   ├── freebayes.pvar_original
│   │   ├── freebayes_tmp.pvar
│   │   ├── freebayes.vcf
│   │   ├── pca_projection
│   │   │   ├── final_subset_pruned_data_pcs.log
│   │   │   ├── final_subset_pruned_data_pcs.sscore
│   │   │   ├── subset_pruned_1000g_pcs.acount
│   │   │   ├── subset_pruned_1000g_pcs.eigenval
│   │   │   ├── subset_pruned_1000g_pcs.eigenvec
│   │   │   ├── subset_pruned_1000g_pcs.eigenvec.allele
│   │   │   ├── subset_pruned_1000g_pcs.log
│   │   │   ├── subset_pruned_1000g_pcs_projected.log
│   │   │   └── subset_pruned_1000g_pcs_projected.sscore
│   │   └── pca_sex_checks_original
│   │       ├── ancestry_assignments.tsv
│   │       ├── Ancestry_PCAs.png
│   │       └── variables.tsv
│   ├── individual_3
│   │   ├── common_snps
│   │   │   ├── final_subset_pruned_data.bed
│   │   │   ├── final_subset_pruned_data.bim
│   │   │   ├── final_subset_pruned_data.fam
│   │   │   ├── final_subset_pruned_data.log
│   │   │   ├── final_subset_pruned_data.pgen
│   │   │   ├── final_subset_pruned_data.psam
│   │   │   ├── final_subset_pruned_data.pvar
│   │   │   ├── snps_1000g.tsv
│   │   │   ├── SNPs2keep.txt
│   │   │   ├── snps_data.tsv
│   │   │   ├── subset_1000g.log
│   │   │   ├── subset_1000g.pgen
│   │   │   ├── subset_1000g.psam
│   │   │   ├── subset_1000g.pvar
│   │   │   ├── subset_data.log
│   │   │   ├── subset_data.pgen
│   │   │   ├── subset_data.prune.out
│   │   │   ├── subset_data.psam
│   │   │   ├── subset_data.pvar
│   │   │   ├── subset_pruned_1000g.bed
│   │   │   ├── subset_pruned_1000g.bim
│   │   │   ├── subset_pruned_1000g.fam
│   │   │   ├── subset_pruned_1000g.log
│   │   │   ├── subset_pruned_1000g.pgen
│   │   │   ├── subset_pruned_1000g.popu
│   │   │   ├── subset_pruned_1000g.prune.in
│   │   │   ├── subset_pruned_1000g.prune.out
│   │   │   ├── subset_pruned_1000g.psam
│   │   │   ├── subset_pruned_1000g.pvar
│   │   │   ├── subset_pruned_data_1000g_key.txt
│   │   │   ├── subset_pruned_data.log
│   │   │   ├── subset_pruned_data_original.pvar
│   │   │   ├── subset_pruned_data.pgen
│   │   │   ├── subset_pruned_data.psam
│   │   │   ├── subset_pruned_data.pvar
│   │   │   └── subset_pruned_data_temp.pvar
│   │   ├── freebayes_hg19.vcf
│   │   ├── freebayes_hg19.vcf.unmap
│   │   ├── freebayes.log
│   │   ├── freebayes.pgen
│   │   ├── freebayes.psam
│   │   ├── freebayes.pvar
│   │   ├── freebayes.pvar_original
│   │   ├── freebayes_tmp.pvar
│   │   ├── freebayes.vcf
│   │   ├── pca_projection
│   │   │   ├── final_subset_pruned_data_pcs.log
│   │   │   ├── final_subset_pruned_data_pcs.sscore
│   │   │   ├── subset_pruned_1000g_pcs.acount
│   │   │   ├── subset_pruned_1000g_pcs.eigenval
│   │   │   ├── subset_pruned_1000g_pcs.eigenvec
│   │   │   ├── subset_pruned_1000g_pcs.eigenvec.allele
│   │   │   ├── subset_pruned_1000g_pcs.log
│   │   │   ├── subset_pruned_1000g_pcs_projected.log
│   │   │   └── subset_pruned_1000g_pcs_projected.sscore
│   │   └── pca_sex_checks_original
│   │       ├── ancestry_assignments.tsv
│   │       ├── Ancestry_PCAs.png
│   │       └── variables.tsv
│   ├── individual_4
│   │   ├── common_snps
│   │   │   ├── final_subset_pruned_data.bed
│   │   │   ├── final_subset_pruned_data.bim
│   │   │   ├── final_subset_pruned_data.fam
│   │   │   ├── final_subset_pruned_data.log
│   │   │   ├── final_subset_pruned_data.pgen
│   │   │   ├── final_subset_pruned_data.psam
│   │   │   ├── final_subset_pruned_data.pvar
│   │   │   ├── snps_1000g.tsv
│   │   │   ├── SNPs2keep.txt
│   │   │   ├── snps_data.tsv
│   │   │   ├── subset_1000g.log
│   │   │   ├── subset_1000g.pgen
│   │   │   ├── subset_1000g.psam
│   │   │   ├── subset_1000g.pvar
│   │   │   ├── subset_data.log
│   │   │   ├── subset_data.pgen
│   │   │   ├── subset_data.prune.out
│   │   │   ├── subset_data.psam
│   │   │   ├── subset_data.pvar
│   │   │   ├── subset_pruned_1000g.bed
│   │   │   ├── subset_pruned_1000g.bim
│   │   │   ├── subset_pruned_1000g.fam
│   │   │   ├── subset_pruned_1000g.log
│   │   │   ├── subset_pruned_1000g.pgen
│   │   │   ├── subset_pruned_1000g.popu
│   │   │   ├── subset_pruned_1000g.prune.in
│   │   │   ├── subset_pruned_1000g.prune.out
│   │   │   ├── subset_pruned_1000g.psam
│   │   │   ├── subset_pruned_1000g.pvar
│   │   │   ├── subset_pruned_data_1000g_key.txt
│   │   │   ├── subset_pruned_data.log
│   │   │   ├── subset_pruned_data_original.pvar
│   │   │   ├── subset_pruned_data.pgen
│   │   │   ├── subset_pruned_data.psam
│   │   │   ├── subset_pruned_data.pvar
│   │   │   └── subset_pruned_data_temp.pvar
│   │   ├── freebayes_hg19.vcf
│   │   ├── freebayes_hg19.vcf.unmap
│   │   ├── freebayes.log
│   │   ├── freebayes.pgen
│   │   ├── freebayes.psam
│   │   ├── freebayes.pvar
│   │   ├── freebayes.pvar_original
│   │   ├── freebayes_tmp.pvar
│   │   ├── freebayes.vcf
│   │   ├── pca_projection
│   │   │   ├── final_subset_pruned_data_pcs.log
│   │   │   ├── final_subset_pruned_data_pcs.sscore
│   │   │   ├── subset_pruned_1000g_pcs.acount
│   │   │   ├── subset_pruned_1000g_pcs.eigenval
│   │   │   ├── subset_pruned_1000g_pcs.eigenvec
│   │   │   ├── subset_pruned_1000g_pcs.eigenvec.allele
│   │   │   ├── subset_pruned_1000g_pcs.log
│   │   │   ├── subset_pruned_1000g_pcs_projected.log
│   │   │   └── subset_pruned_1000g_pcs_projected.sscore
│   │   └── pca_sex_checks_original
│   │       ├── ancestry_assignments.tsv
│   │       ├── Ancestry_PCAs.png
│   │       └── variables.tsv
│   ├── individual_5
│   │   ├── common_snps
│   │   │   ├── final_subset_pruned_data.bed
│   │   │   ├── final_subset_pruned_data.bim
│   │   │   ├── final_subset_pruned_data.fam
│   │   │   ├── final_subset_pruned_data.log
│   │   │   ├── final_subset_pruned_data.pgen
│   │   │   ├── final_subset_pruned_data.psam
│   │   │   ├── final_subset_pruned_data.pvar
│   │   │   ├── snps_1000g.tsv
│   │   │   ├── SNPs2keep.txt
│   │   │   ├── snps_data.tsv
│   │   │   ├── subset_1000g.log
│   │   │   ├── subset_1000g.pgen
│   │   │   ├── subset_1000g.psam
│   │   │   ├── subset_1000g.pvar
│   │   │   ├── subset_data.log
│   │   │   ├── subset_data.pgen
│   │   │   ├── subset_data.prune.out
│   │   │   ├── subset_data.psam
│   │   │   ├── subset_data.pvar
│   │   │   ├── subset_pruned_1000g.bed
│   │   │   ├── subset_pruned_1000g.bim
│   │   │   ├── subset_pruned_1000g.fam
│   │   │   ├── subset_pruned_1000g.log
│   │   │   ├── subset_pruned_1000g.pgen
│   │   │   ├── subset_pruned_1000g.popu
│   │   │   ├── subset_pruned_1000g.prune.in
│   │   │   ├── subset_pruned_1000g.prune.out
│   │   │   ├── subset_pruned_1000g.psam
│   │   │   ├── subset_pruned_1000g.pvar
│   │   │   ├── subset_pruned_data_1000g_key.txt
│   │   │   ├── subset_pruned_data.log
│   │   │   ├── subset_pruned_data_original.pvar
│   │   │   ├── subset_pruned_data.pgen
│   │   │   ├── subset_pruned_data.psam
│   │   │   ├── subset_pruned_data.pvar
│   │   │   └── subset_pruned_data_temp.pvar
│   │   ├── freebayes_hg19.vcf
│   │   ├── freebayes_hg19.vcf.unmap
│   │   ├── freebayes.log
│   │   ├── freebayes.pgen
│   │   ├── freebayes.psam
│   │   ├── freebayes.pvar
│   │   ├── freebayes.pvar_original
│   │   ├── freebayes_tmp.pvar
│   │   ├── freebayes.vcf
│   │   ├── pca_projection
│   │   │   ├── final_subset_pruned_data_pcs.log
│   │   │   ├── final_subset_pruned_data_pcs.sscore
│   │   │   ├── subset_pruned_1000g_pcs.acount
│   │   │   ├── subset_pruned_1000g_pcs.eigenval
│   │   │   ├── subset_pruned_1000g_pcs.eigenvec
│   │   │   ├── subset_pruned_1000g_pcs.eigenvec.allele
│   │   │   ├── subset_pruned_1000g_pcs.log
│   │   │   ├── subset_pruned_1000g_pcs_projected.log
│   │   │   └── subset_pruned_1000g_pcs_projected.sscore
│   │   └── pca_sex_checks_original
│   │       ├── ancestry_assignments.tsv
│   │       ├── Ancestry_PCAs.png
│   │       └── variables.tsv
│   └── individual_6
│       ├── common_snps
│       │   ├── final_subset_pruned_data.bed
│       │   ├── final_subset_pruned_data.bim
│       │   ├── final_subset_pruned_data.fam
│       │   ├── final_subset_pruned_data.log
│       │   ├── final_subset_pruned_data.pgen
│       │   ├── final_subset_pruned_data.psam
│       │   ├── final_subset_pruned_data.pvar
│       │   ├── snps_1000g.tsv
│       │   ├── SNPs2keep.txt
│       │   ├── snps_data.tsv
│       │   ├── subset_1000g.log
│       │   ├── subset_1000g.pgen
│       │   ├── subset_1000g.psam
│       │   ├── subset_1000g.pvar
│       │   ├── subset_data.log
│       │   ├── subset_data.pgen
│       │   ├── subset_data.prune.out
│       │   ├── subset_data.psam
│       │   ├── subset_data.pvar
│       │   ├── subset_pruned_1000g.bed
│       │   ├── subset_pruned_1000g.bim
│       │   ├── subset_pruned_1000g.fam
│       │   ├── subset_pruned_1000g.log
│       │   ├── subset_pruned_1000g.pgen
│       │   ├── subset_pruned_1000g.popu
│       │   ├── subset_pruned_1000g.prune.in
│       │   ├── subset_pruned_1000g.prune.out
│       │   ├── subset_pruned_1000g.psam
│       │   ├── subset_pruned_1000g.pvar
│       │   ├── subset_pruned_data_1000g_key.txt
│       │   ├── subset_pruned_data.log
│       │   ├── subset_pruned_data_original.pvar
│       │   ├── subset_pruned_data.pgen
│       │   ├── subset_pruned_data.psam
│       │   ├── subset_pruned_data.pvar
│       │   └── subset_pruned_data_temp.pvar
│       ├── freebayes_hg19.vcf
│       ├── freebayes_hg19.vcf.unmap
│       ├── freebayes.log
│       ├── freebayes.pgen
│       ├── freebayes.psam
│       ├── freebayes.pvar
│       ├── freebayes.pvar_original
│       ├── freebayes_tmp.pvar
│       ├── freebayes.vcf
│       ├── pca_projection
│       │   ├── final_subset_pruned_data_pcs.log
│       │   ├── final_subset_pruned_data_pcs.sscore
│       │   ├── subset_pruned_1000g_pcs.acount
│       │   ├── subset_pruned_1000g_pcs.eigenval
│       │   ├── subset_pruned_1000g_pcs.eigenvec
│       │   ├── subset_pruned_1000g_pcs.eigenvec.allele
│       │   ├── subset_pruned_1000g_pcs.log
│       │   ├── subset_pruned_1000g_pcs_projected.log
│       │   └── subset_pruned_1000g_pcs_projected.sscore
│       └── pca_sex_checks_original
│           ├── ancestry_assignments.tsv
│           ├── Ancestry_PCAs.png
│           └── variables.tsv
└── snps_1000g_common_across_sites.tsv
Inforamtive Results#
Your output directory will have summarized results in it (ancestry_assignments.tsv and Ancestry_PCAs.png).
There are files of each individual in their separate direcotires in the pca_sex_checks_original directory (for example /path/to/parent/out/dir/Pool1/individual_1/pca_sex_checks_original/Ancestry_PCAs.png).
Here’s an example of each of these;
ancestry_assignments.tsv: This file contains the predicted ancestries for all the samples as well as all the principal component locations for each individual (this will be in your output directory /path/to/parent/out/dir/ancestry_assignments.tsv).
The assignments are the second to last column:
FID |
IID |
PC1 |
PC2 |
PC3 |
PC4 |
PC5 |
PC6 |
PC7 |
PC8 |
PC9 |
PC10 |
AFR |
AMR |
EAS |
EUR |
SAS |
Final_Assignment |
Pool |
|---|---|---|---|---|---|---|---|---|---|---|---|---|---|---|---|---|---|---|
0 |
1 |
0.162 |
-0.089 |
-0.041 |
-0.014 |
0.059 |
0.010 |
0.028 |
-0.015 |
0.011 |
0.019 |
0 |
0 |
1 |
0 |
0 |
EAS |
RZ731_Pool8 |
0 |
2 |
0.115 |
0.089 |
0.037 |
-0.019 |
0.017 |
0.030 |
0.047 |
0.008 |
-0.017 |
-0.012 |
0 |
0 |
0 |
1 |
0 |
EUR |
RZ731_Pool8 |
0 |
3 |
0.147 |
-0.101 |
-0.089 |
-0.001 |
0.116 |
0.014 |
0.006 |
0.037 |
0.027 |
-0.035 |
0 |
0 |
1 |
0 |
0 |
EAS |
RZ731_Pool8 |
0 |
4 |
0.150 |
0.108 |
0.023 |
-0.062 |
0.029 |
0.024 |
-0.010 |
-0.008 |
-0.034 |
-0.013 |
0 |
0 |
0 |
1 |
0 |
EUR |
RZ731_Pool8 |
0 |
5 |
0.132 |
0.069 |
-0.033 |
-0.029 |
0.045 |
0.017 |
0.020 |
-0.011 |
0.011 |
0.023 |
0 |
0.11 |
0 |
0.89 |
0 |
EUR |
RZ731_Pool8 |
0 |
6 |
0.149 |
0.105 |
-0.022 |
-0.053 |
0.063 |
0.083 |
-0.014 |
-0.029 |
-0.020 |
0.008 |
0 |
0 |
0 |
1 |
0 |
EUR |
RZ731_Pool8 |
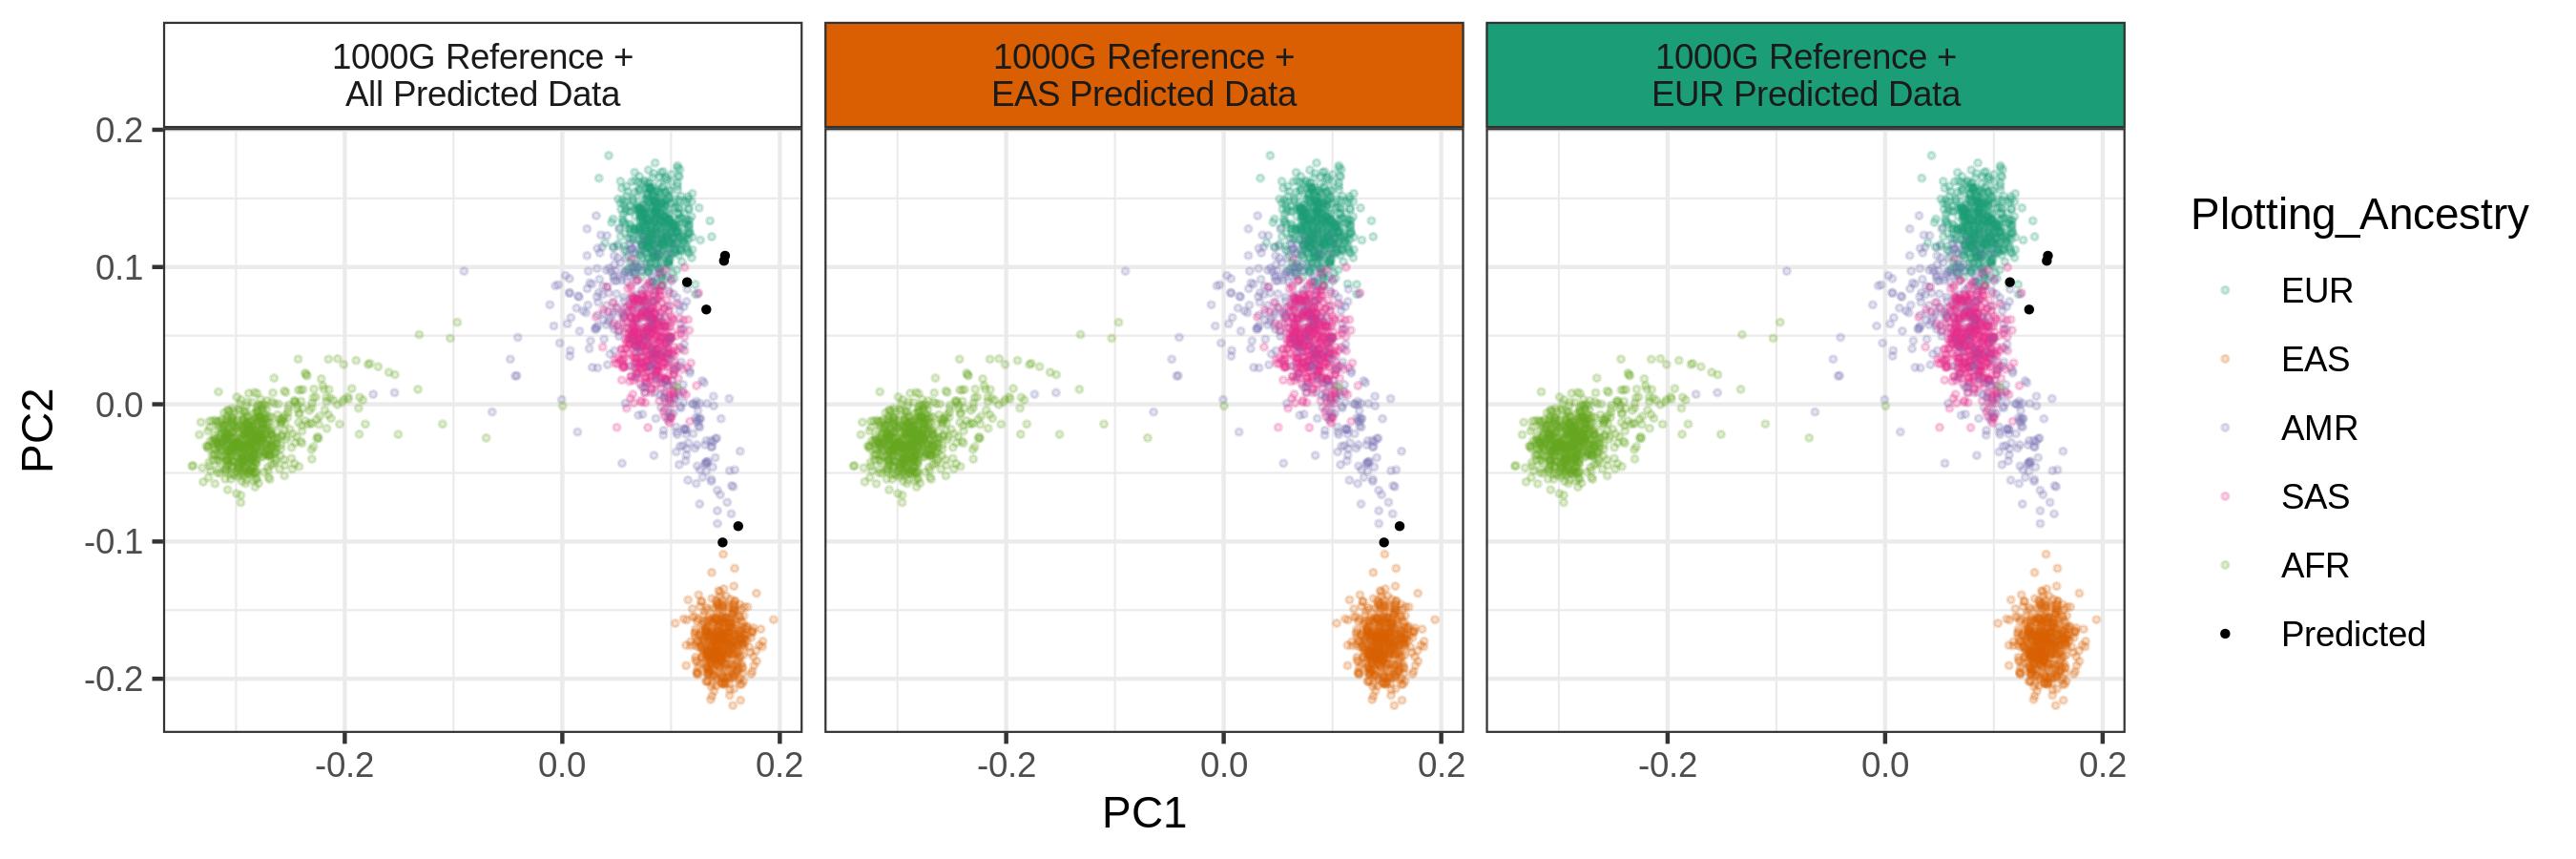
Ancestry_PCAs.png: a separate figure generated for each individual in each pool. For example, a PCA plot for individual 1 in Pool 1: /path/to/parent/out/dir/Pool1/individual_1/pca_sex_checks_original/Ancestry_PCAs.png.
This figure shows the 1000G individual locations in PC space compared to the individual. For example:
There will be an
ancestry_assignments.tsvfile generated for each individual in each pool and one that has all the individuals joined together in the base output directory.This file has the annotations and probabilities for each pool. For example:
FID
IID
PC1
PC2
PC3
PC4
PC5
PC6
PC7
PC8
PC9
PC10
AFR
AMR
EAS
EUR
SAS
combined_assignment
Final_Assignment
0
Poool1
0.137
-0.108
-0.0250
-0.042
0.032
-0.042
0.001
-0.021
-0.086
-0.019
0
0
1
0
0
EAS
EAS
Additional Results with Reference-based Exectution#
If you have reference SNP genotypes (i.e. microarray or whole exome or genome sequencing-called SNPs) and decided to estimate SNP-based ancestry, you will have additional results that compare the reference and single-cell ancestry predictions. These will be located in:
/path/to/parent/out/dir/reference: This will contain the ancestry predictions for the reference-based ancestry predictions per individual./path/to/parent/out/dir/ref_sc_ancestry_prediction_comparison: This will provide results on reference vs single cell based ancestry predictions. These are the main comparison files with the two most informative ones highlighted and additional information below:
snp_ancestry_predictions.tsv
reference_ancestry_numbers.png
predicted_ancestry_numbers_correct.png
predicted_ancestry_numbers_correct_identified.png
statistics_heatmap.png
predicted_numbers_statistics_heatmap_combined.png
assignments_probabilities_w_ref.png
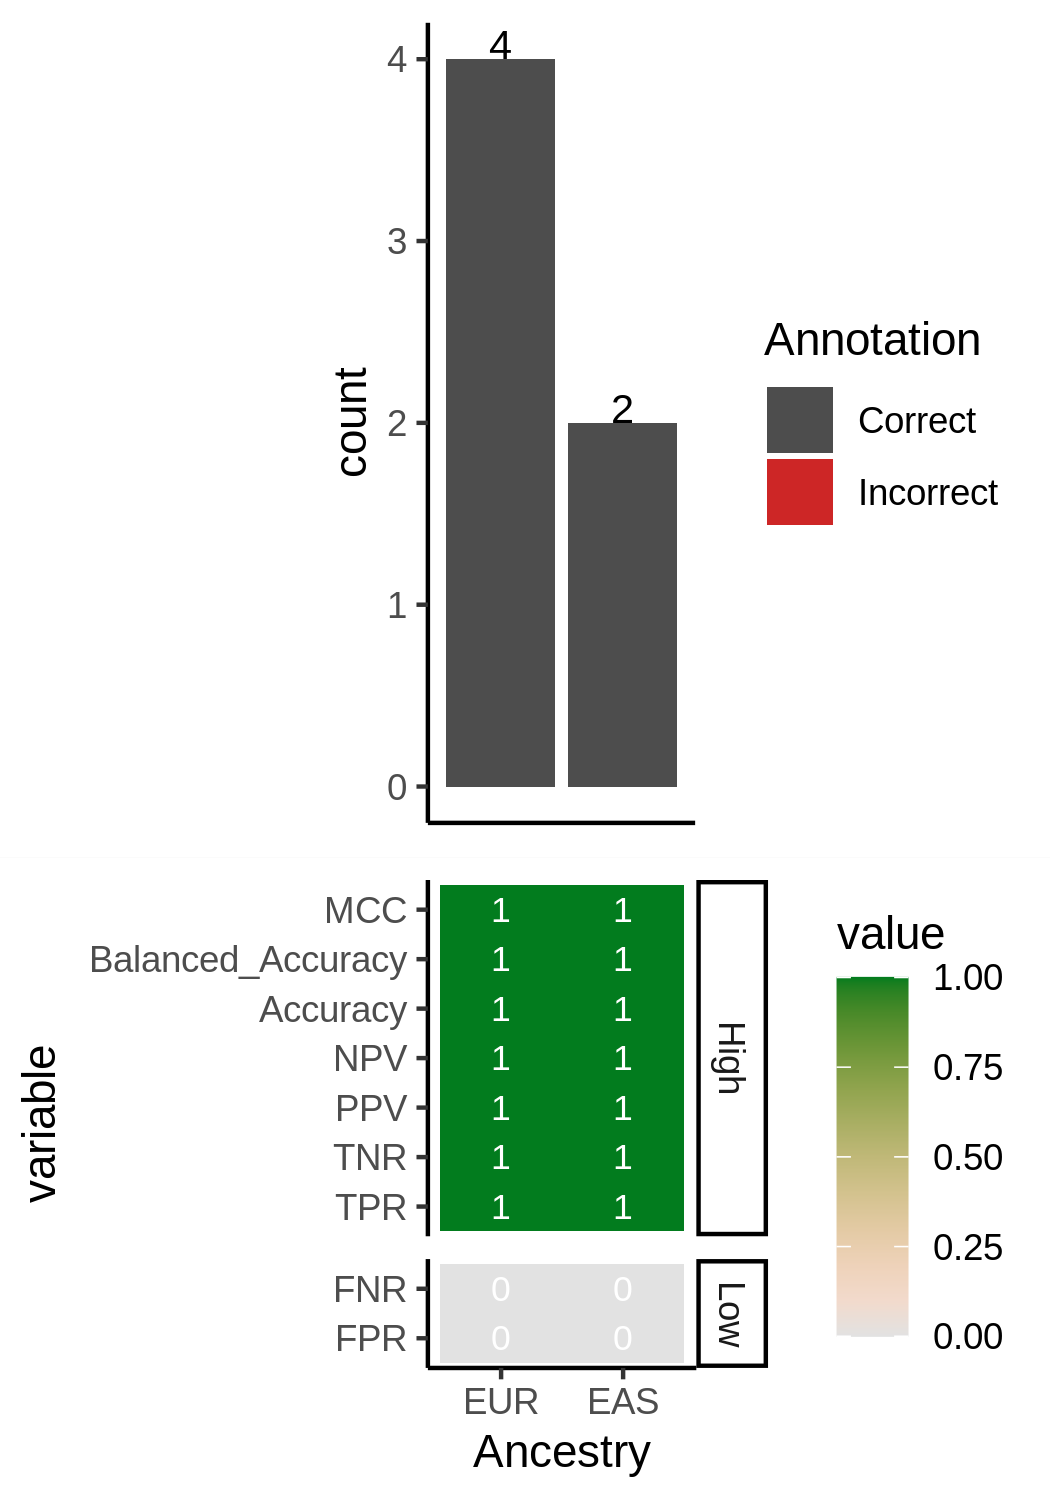
The predicted_numbers_statistics_heatmap_combined.png figure shows the number of individuals classified to each ancestry with the single cell data and colored by if they correctly or incorrectly match the reference-annotated SNP genotype data
and the heatmap below shows some statistical metrics for quantifying the single cell derived ancestry predictions:
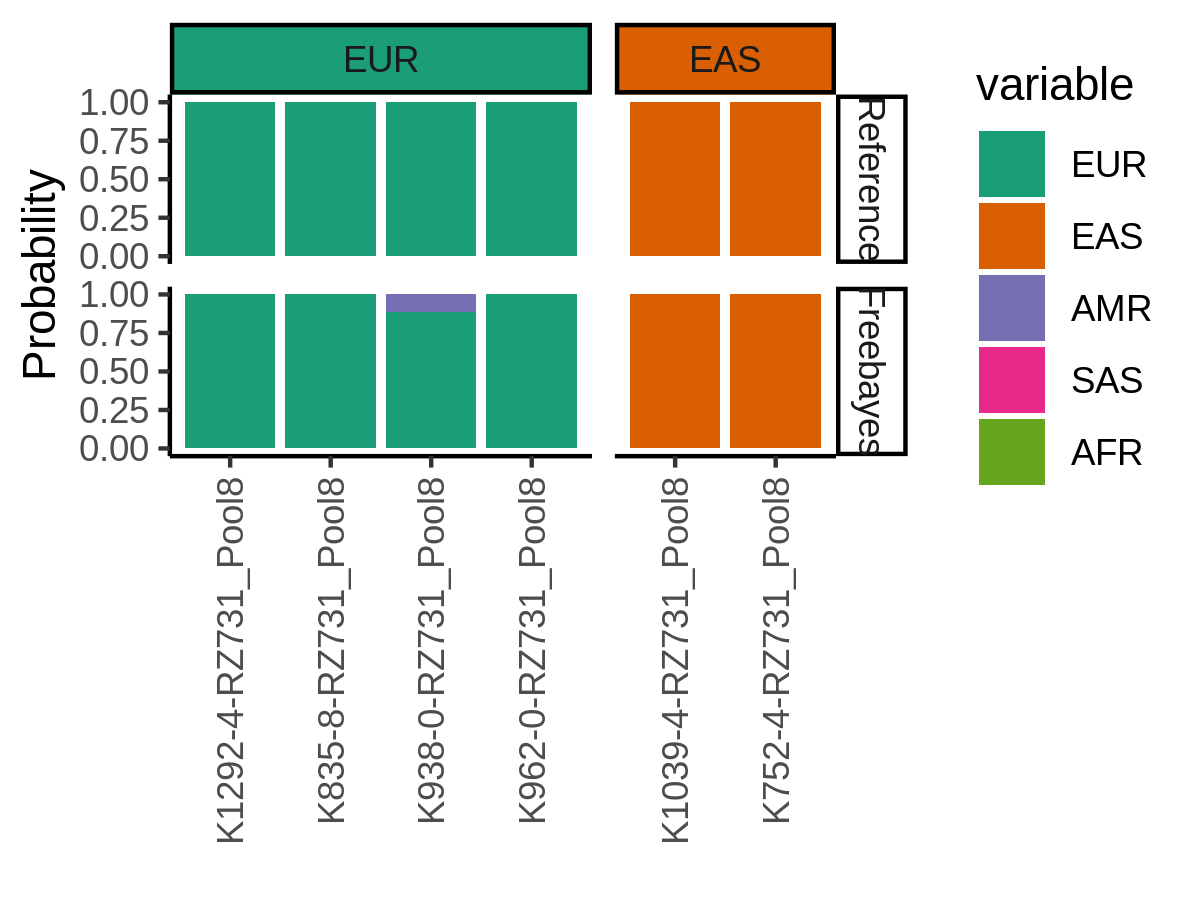
The assignments_probabilities_w_ref.png figure show the probability of each sample to be classified to each of the different ancestries.
This includes the reference-based predictions (microarray or whole exome or genome sequencing data) compared to the single cell based predictions